An Introduction to Pipeline Physics
Why PPM needs pipeline physics
Decision theory, the theoretical foundation of project portfolio management (PPM), is evolving to treat uncertainty differently than it treats risk. (See my discussion, "The difference between theory and practice: it's disappearing.") These advances suggest changing PPM in significant ways:
- Instead of forecasting and optimizing portfolio value, better management of uncertainty, which reduces the frequency of decision errors, creates more value.
- The common, static, portfolio model should be replaced with a dynamic, pipeline (phase-gate) model.
Consider each of these changes.
Pipelines versus portfolios: PPM's current best practices - decision analysis and portfolio optimization - mimic finance's modern portfolio theory (MPT), but compounds differ from financial assets in a crucial way.
- Investing in financial assets does not resolve uncertainty; tomorrow's stock prices are as uncertain as today's prices were yesterday.
- Investments in projects resolve uncertainty, and for product development, resolving uncertainty creates great value.
This distinction is the reason why financial assets are managed with portfolios while projects are managed with pipelines. (To learn more about this distinction, see my discussion, "How PPM differs from MPT.")
Managing uncertainty versus maximizing value: Previously, managers managed manufacturing, supply chain management, project management and product development by using a two-step process of forecasting and optimization, or colloquially, predict-and-plan. The results were dismal. Subsequently, each function adopted new frameworks that succeeded by managing uncertainty better, and these new frameworks are now well-known: just-in-time, theory of constraints, flexibility, lean and agile. PPM lags behind other business functions by adhering to the old, harmful predict-and-plan approach. (To learn more about this history, see my discussion, "Does PPM need a new paradigm?")
Managers must organize project evaluations, prject selection, project work and their pipeline management to better manage uncertainty. This discussion addresses pipeline management, showing how the management of upstream phase's and gate affect downstream results. Pipeline physics, a new mathematical model of phase-gate systems, describes these relationships.
While this discussion addresses pipelines, some executives may wish to learn more about uncertainty's impact on PPM. These executives may appreciate the discussions mentioned above and the following discussions:
- Why some C-level executives are skeptical of PPM.
- Action flexibility and state flexibility in PPM.
- What modern portfolio theory reveals about PPM.
For information about managing uncertainty in drug development, see my discussions, "How to make drug development more productive" and "Managing drug development pipelines."
Pipeline capacity
A principal property of a pipeline is its limited capacity. This capacity does not refer to resource constraints, which can be increased with investment, but with the impact of uncertainty on projects and project selection. Uncertainty produces the following relationship:
The success rates of the projects that emerge from a pipeline vary inversely with pipeline throughput.
To observe this relationship, let's see a simple pipeline. Figure 1 presents a product development pipeline with a single gate. The front-end creates ideas for innovations, and gate 1 selects ideas to be developed and launched in the market. The market determines winning and losing projects.

Figure 1: A product development pipeline with a single gate.
To define pipeline capacity, begin with the idea of winners and losers. Managers must define project success and their definition becomes criteria for evaluating projects, selecting projects and measuring results. They may define success by strategic goals, IT system capabilities, profit, market share or any result befitting their business. Different types of projects should have different definitions of success.
Not defining project success and then evaluating and selecting projects via expected values, net present values or project scores alone abdicates managerial responsibility; it also makes pipeline management a mess.
Once managers define success, they can ask, "What is my pipeline's capacity to produce successful projects?"
A pipeline's capacity begins at the front-end, which produces a stream of choices that feed the pipeline. A fraction of these project proposals can produce successful projects, or winners, as measured by managers' definitions of project success. The remaining ideas are destined to be losers.
To illustrate this relationship, suppose the front-end in Figure 1 produces 30% winners and 70% losers. If managers fund all the proposals produced by the front-end, the result is obvious. Thirty percent of market launches will succeed and 70% will fail.
Suppose a 30% success rate is too low. Managers can raise the success rate by funding selectively at gate 1, striving to pick the winners and cancel the losers.
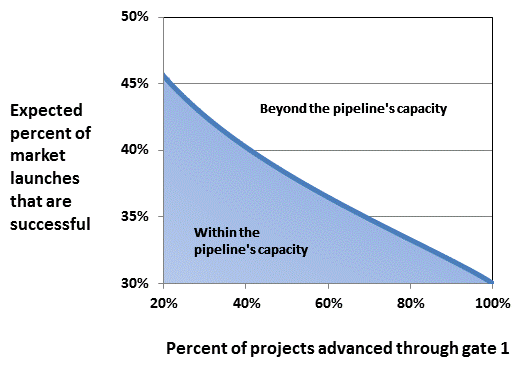
Figure 2: How throughput (percent of projects advanced through gate 1) affects the pipeline success rate (expected percent of market launches that are successful).
How is project selection related to the success of market launches? Figure 2 provides the answer. If there is no selection, so all projects advance through gate 1, the success rate of market launches is 30% as expected. As managers become more selective at gate 1, funding only the better candidates, they raise the expected success rate of market launches.
Unfortunately, this relationship has a downside. As Figure 2 illustrates, to achieve a higher expected success rate, managers must be more selective, sending fewer projects downstream and reducing pipeline throughput. Conversely, suppose that being desperate for winners, managers liberally advance projects through gate 1. While throughput increases, the success rate of market launches will fall.
The trade-off depicted by Figure 2 is the pipeline's capacity. By being more or less selective at gate 1, managers can produce any combination of throughput and expected success rate on the curve. Via poor project management, which causes good projects to fail, managers can produce below the curve as well. In this way, poor project management reduces a pipeline's capacity and it is one reason why project management is vital to PPM.
Unfortunately, managers cannot achieve the combinations of throughput and expected success rates that lie above the curve. Suppose managers wish to fund 40% of the projects arriving at gate 1 and that they desire a 45% expected success rate for market launches. This point lies above the curve in Figure 2, so the pipeline cannot achieve this result. It has insufficient capacity.
A second quality of pipelines varies with throughput. Increased throughput intensifies cycles of booms and busts in which numerous failures occur between successes. These cycles are particularly problematic in industries that have low project success rates such as pharmaceuticals. One can learn more about this relationship by reading my forthcoming discussion, "Pipeline volatility: How to have more boom and less bust."
One may wonder, "How can I increase my pipeline's capacity? How can I increase throughput while maintaining, or even increasing, my pipeline's expected project success rate?" One can increase a pipeline's capacity via three methods: (1) improving the front-end, (2) increasing a gate's resolution and (3) adding gates. Let's review each method.
Increase pipeline capacity by improving the front-end
The front-end is the most important part of a pipeline. Improving it raises a pipeline's capacity, reduces the resolution that gates need to be successful (see below) and makes a pipeline more forgiving of mistakes. (See my discussion, "How discovery impacts development.")
Let's see how the front-end affects the capacity of the pipeline in Figure 1. Suppose managers improve the front-end so that 35% of its project proposals are winners, instead of the 30% form the previous example. Figure 3 reveals the results. The pipeline's capacity shifts upward, and managers can now achieve their goal of funding 40% of projects while having an expected project success rate of 45%. Managers could fund 46% of project proposals and still achieve the 45% expected success rate they desire.
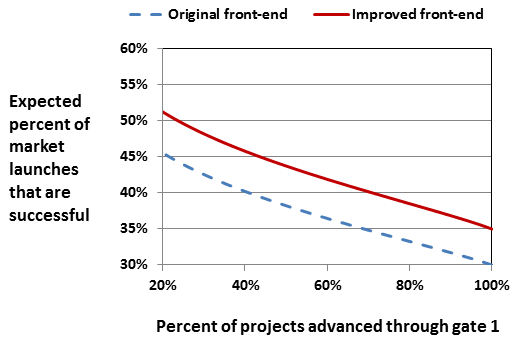
Figure 3: Improving the front-end, so it produces better ideas, increases a pipeline's capacity.
Increase pipeline capacity by improving a gate's resolution
In figures 2 and 3, I did not describe how the depicted curve gets its shape. For any gate, the gate's resolution determines the gate's ability to distinguish winners from losers. With higher resolution, a gate makes fewer project selection errors, funding fewer losers (false-positives) and canceling fewer winners (false-negatives). A gate's resolution determines the shape of the curve, or equivalently, the trade-off between throughput and the expected project success rate.
How do you increase a gate's resolution? There are two methods. First, resolve more uncertainty in the stage that precedes the gate. Figure 4 illustrates this approach. Some product development is moved upstream between the front-end and gate 1. This initial development resolves some uncertainty so gate 1 can better distinguish winners from losers.

Figure 4: The pipeline from Figure 1 is modified to include some development before gate 1. This initial development resolves some uncertainty, which raises gate 1's resolution.
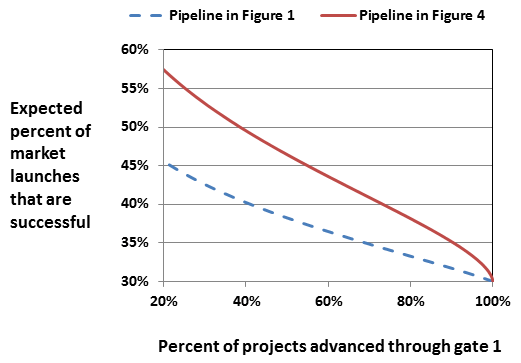
Figure 5: Resolving more uncertainty prior to gate 1 increases gate 1's resolution, improves project selection and increases the pipeline's capacity.
Figure 5 illustrates the impact of resolution on increasing pipeline capacity. The top curve represents a gate with higher resolution and the bottom curve represents a gate with lower resolution. For every level of throughput, except for 100%, for which selection is absent, higher resolution produces a greater expected project success rate.
The second method of increasing resolution at a gate organizes project evaluation and selection to better manage uncertainty. When uncertainty is significant, and it usually is, scoring models, capital asset budgeting models and decision trees can mismanage uncertainty. For example, erroneous revenue forecasts can destroy the project evaluations made by decision trees and capital budgeting models even when all other information is reliable. (See my discussion, "Revenue forecasting errors dominate decision trees." Additionally, see my forthcoming discussions, "The failure of general decision trees" and "You can't reduce uncertainty by planning.")
Scoring models better manage the errors in revenue estimates, and in other overbearing information, by limiting its impact on project evaluation. Generally, an attribute contributes only about 1/n of an attribute's score. Unfortunately, scoring models suffer from having a low correlation of project scores with project value, thus trading one problem for another. (See my discussion, "Is my scoring model good enough?")
Scoring models, capital asset budgeting models and decision trees can harm PPM and pipelines because these metrics predict project results. Basing project selection on predictions ignores the greatest benefit a pipeline offers to you. With a pipeline, you can delay some selection decisions and the use of some information until uncertainty resolves downstream.
Without using traditional evaluation metrics, how does one evaluate and select projects? How can one delay decisions? There are three ways: (1) use non-compensatory metrics, and especially upstream (2) test for failure rather than for success and (3) coordinate project management with PPM.
- Noncompensatory metrics: These metrics include screens and fast and frugal trees and they "split" information so you apply information separately. For example, if information about technological risk is reliable but information about market potential is not, first screen projects by technical risk and then by market potential. Since the marketing information is unreliable, one can apply the marketing information softly, canceling outliers such as obvious losers. Subsequently at downstream gates where marketing information is more reliable, you can apply marketing criteria more strongly and more finely discriminate projects. (One can learn about these concepts and about fast and frugal heuristics from my forthcoming discussion, "To combine or not to combine? That is the question.")
- Select out, not in: Project success is complex, requiring numerous variables to function successfully in concert. Meanwhile, failure is simpler, often occurring for a single reason such as a technology failure or rejection by customers. By testing projects on failure criteria, one can remove losers more reliably than you can pick winners. Then concentrate investment on the remaining projects while deferring a full evaluation and comparison of these projects until a downstream gate, where presumably, uncertainty is less and such comparisons are more reliable.
- Coordinating project management with PPM: One can organize project evaluation to resolve more uncertainty upstream including addressing significant risks and identifying failures. For project decisions that cannot be resolved upstream, one should make projects flexible so they can adapt as uncertainty decreases downstream. In summary, coordinate the work done in the phases with the distribution of project evaluation and selection over the gates. Although the above example doesn't show it, non-compensatory metrics and eliminating failures integrates well with flexible project management methods such as set-based design, modular architectures and Agile.
Some experts will claim that the ratio scales of compensatory metrics (scoring models, capital asset budgeting models and decision trees) produce better decision-making than classifications such as the winners and losers dichotomy. However when uncertainty is significant, classification can outperform ratio scales. The intuition for this hypothesis, which must still be proven for the decisions of PPM, is found in the following paper, which studies the impact of uncertainty on decisions:
- Al-Najjar, N. I. and M. M. Pai (2014), "Coarse decision making and overfitting," Journal of Economic Theory, vol. 150, pp. 467-486. (Also see the working paper version of this paper.)
One can learn about the theory derived in this paper by reading my discussion "The difference between theory and practice: it's disappearing." Additional intuition about ratio scales, categories and decision-making comes from studies of fast and frugal heuristics. One can read about these heuristics in my forthcoming discussion, "To combine or not to combine? That is the question."
Traditional metrics are most useful when (1) sufficient uncertainty has resolved so that forecasts are accurate and precise enough to produce good resolution and (2) there are limited opportunities to further reduce uncertainty. These circumstances may occur at the end of the pipeline, but why not redesign the end of the pipeline? One can launch a project in stages, delaying some decisions even more and further reducing the dependence on forecasts. As a general rule, eliminate as much forecasting from PPM as possible. Replace prediction with adaptation.
The idea of splitting information and distributing project evaluation and selection across a pipeline implies a multi-gate system, so let's see how adding a gate to a pipeline affects the pipeline's capacity.
Increase pipeline capacity by adding a gate
Adding a gate to a pipeline can dramatically increase its capacity. Several advantages of a multi-gate system enable the expansion including the following advantages:
- Advantage 1: As suggested, one can organize project evaluation and selection around the reduction of uncertainty that occurs as projects progress down a pipeline. By doing so, it increases the resolution at numerous gates and productively delays some decisions. Both results increase the pipeline's capacity. In contrast, maximizing portfolio value at upstream gates foregoes this advantage, as it assesses all projects and all aspects of them when uncertainty is too high.
- Advantage 2: A gate that funds selectively increases the percent of projects that are winners, called the base rate, that arrives at the next downstream gate. Multiple gates successively raise the base rate so that most of the projects in the downstream phases are winners. Let's illustrate this impact by adding a gate to the pipeline of Figure 4. Figure 6 illustrates the result of adding a gate immediately after the front-end. Suppose the front-end and the new gate are equal to those of Figure 1. Then 30% percent of the projects leaving the front-end are winners and gate 1 can raise the percent of winners leaving the gate as illustrated by Figure 2. The better set of projects then advances to initial development (which resolves some uncertainty) and gate 2, which further raises the percent of winning projects heading downstream.
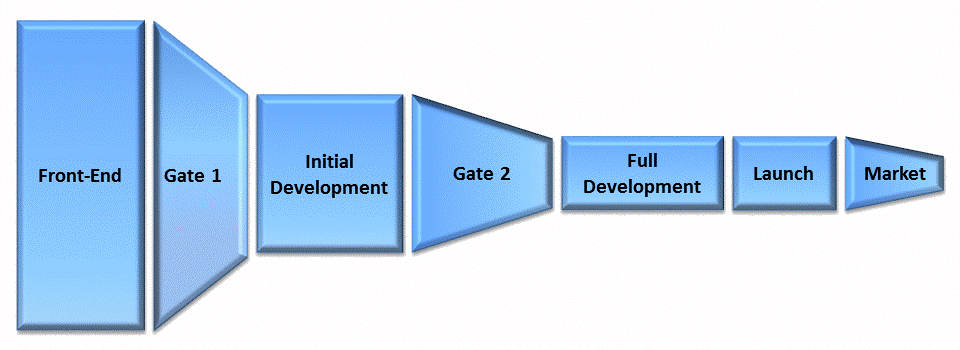
Figure 6: Pipeline from Figure 4 with a gate inserted between the front-end and initial development.
Comparing the pipelines of Figures 1, 4 and 7 reveals additional advantages of Figure 7's two-gate system:
- Advantage 3: The initial development that precedes gate 2 increases gate 2's resolution.
- Advantage 4: By selectively advancing projects, gate 1 concentrates resources on fewer projects in initial development. Focusing work resolves more uncertainty, further raising the resolution of gate 2.
- Advantage 5: With gate 1 screening project proposals, the front-end can generate more ideas without decreasing the base rate of winners it sends downstream. Gate 1 maintains a standard quality.
For all these advantages, the pipeline of Figure 7 has greater capacity than the pipelines of Figures 1 and 4.
Managing a pipeline
Recall that project selection at a gate affects the base rate of the adjacent downstream gate. Via this relationship, coordinate project selection among a pipeline's gates. Illustrating this point with the pipeline of Figure 7:
- Advancing fewer projects through gate 1 (steep funnel upstream) enables managers to be less selective at gate 2 (shallower funnel downstream). Gate 2 can have higher throughput and still achieve a high success rate for projects.
- Advancing more projects through gate 1 (shallow funnel upstream) requires managers to be more selective downstream (steeper funnel downstream). To achieve a high project success rate, gate 2 must be more selective, canceling more projects downstream.
Properly coordinating the gates shapes a pipeline to manage its costs, capacity and profit. I am still developing metrics and practices to help managers shape their pipelines, but one result is immediately evident. Attempting to produce more winners, managers sometimes push more projects through upstream gates, but this method raises downstream failure rates, increasing losses and decreasing profits.
In addition to shaping a pipeline, which exploits existing capacity, managers must increase a pipeline's capacity. They can apply the three methods mentioned above, and to help them I recommend the following process:
- Experience pipeline management via an interactive simulation. Managers can see how pipelines behave, observe the impact of various issues and problems, learn pipeline physics and test the above prescriptions by using my interactive pipeline simulation.
- Monitor a pipeline for problems. Problems identify the pipeline components that are mismanaging uncertainty and all methods of increasing a pipeline's capacity succeed by better managing uncertainty. I am developing new PPM feedback metrics to help managers monitor their pipelines.
As a final note, project interactions increase risk. By organizing project work to resolve risks and delay decisions, pipelines excellently manage project interactions. In contrast, portfolio optimization is a poor method of managing the risks produced by project interactions. Generally, modeling interactions makes portfolio optimization more sensitive to uncertainty, which can degrade its performance. One can see why by reading my discussion, "Action flexibility versus state flexibility in PPM," and my forthcoming discussion, "Project selection: simple or sophisticated?"
After reading my discussions, many managers wish to share their experiences, thoughts and critiques of my ideas. I always welcome and reply to their comments.
Please share your thoughts with me by using form below. I will send reply to you via email. If you prefer to be contacted by phone, fax or postal mail, please send your comments via my contact page.
© 2014 Pipeline Physics. All rights reserved.
