Fuzzy Front-End Analysis
The equation for filling product development with high-value projects is:
Good Choices + Good Choosing = Profitable Projects
You can evaluate the fuzzy front-end of your company's product development by answering two questions:
- How good are our choices?
- How good is our choosing?
Data analysis techniques can answer these questions.
Some concepts help to illustrate the results of the analysis. Define a high-value project as one that produces outstanding results after launch. Suppose 35% of your company's product development projects produce high value. How did this result arise?
One possibility is that 20% of your project proposals had high value, and by careful evaluation and selection, you boosted the percentage to 35%. The fraction of proposals for high-value projects is called the base rate, and the increase from project selection is called the boost. Answering the above questions requires estimating the base rate (quality of choices) and the boost (quality of choosing).
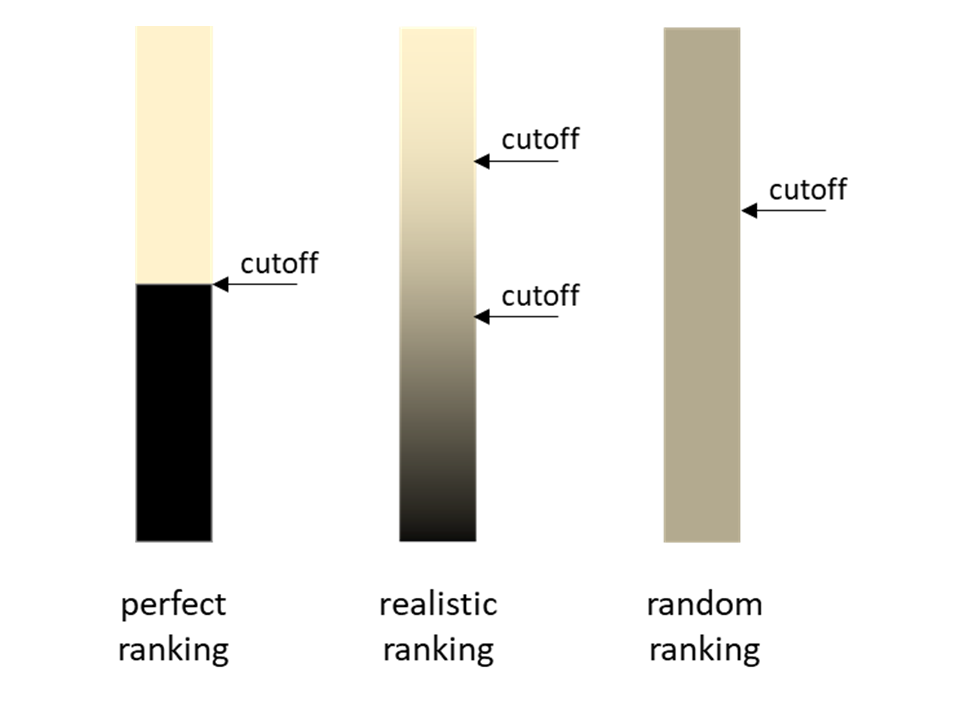
The base rate arises from ideation. To get a higher base rate, you need more high-value ideas and fewer average ones. The boost results from project evaluation and selection. To suggest the impact of selection, Figure 1 presents the rankings of proposals, where yellow represents high-value projects, and black represents average projects.
- Perfect ranking (left column): The left column presents a perfect ranking, with all high-valued projects sitting atop the average ones. You could fund all the high-value projects (only), so all product development projects offer high value. This situation exists when uncertainty is absent, which is fantasy.
- Random ranking (right column): The right column represents a random ranking, where high-value and average projects are fully mixed. Whether you fund more or fewer projects, the fraction of development projects offering high value remains unchanged. This situation exists when uncertainty is pervasive.
- Realistic ranking (middle column): The middle
column represents a realistic ranking. Generally, high-value
projects sit above average projects, but because of uncertainty,
errors exist. Errors occur when an average projects receives a
higher rank than a high-value project. A decent ranking,
pockmarked with errors, is realistic.
With a realistic ranking, funding only the highest ranking projects sends predominantly high-value projects to development, but as you fund down the ranking, the percentage of development projects with high values falls. You face a trade-off between the quantity and quality of product development projects.

Figure 1: A ranking of projects within a category, such as radical or incremental innovation. Yellow represents high-value projects, while black represents average projects (or worse). In this example, 50% of projects offer high value. The rankings on the left, middle, and right represent perfect, realistic, and random rankings.
Figure 2 integrates all the concepts. Consider the red curve. If all proposals become product development projects (no selection), 20% of development projects offer high value. This percentage is the base rate. If you select only a percentage of the projects (funding top-down), throughput falls, but the faction of development projects with high values increases. Unfortunately, the boost is small because project evaluations are poor. The green curve shows the impact of better project evaluations. Being selective gives a greater boost. The blue curve shows the impact of better evaluations (bigger boost) and better ideas (higher base rate). Notice two qualities:
- Increasing the base rate, getting better ideas for new products, always creates value.
- If you are selective, developing less than 50% of new product ideas,
improving selection creates substantial value.

Figure 2: How the quality of ideas (base rate), evaluations, and selection (the boost), determine the quality of project development projects.
With data science, you can estimate the curves in Figure 2 from your project evaluations and results. Generally, the curves answer the following questions:
- What percent of our project proposals are high-value projects?
- How well do our project evaluations distinguish high-value projects from average projects?
- Is our project selection better than random? If so, by how much?
With enough data (projects), you can calculate the curves for important categories: incremental and major innovations, product lines, organizational divisions, and strategic goals.
For additional information, please read our papers:
- In BioPharmaPM newsletter: Introducing PPM Feedback Metrics (p. 6)
- In BioPharmaPM newsletter: Identify Projects with the Greatest Chance of Success (p. 12)
If you wish, kindly share your thoughts by using the form below, via phone (503.332.4095) or LinkedIn. Your concerns, thoughts, and ideas are the most important ones.
